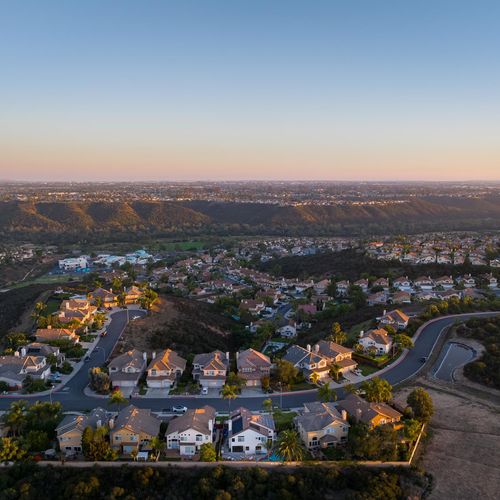
San Diego’s home prices have been leading the pack for months, but it looks like we’re finally seeing a shift.
In August, San Diego home prices rose by 5.7% year-over-year, landing it in 7th place on the 20-city S&P Case-Shiller index. This is quite a change, as San Diego had been either first or second in home price gains for nearly a year. New York took the top spot in August with an 8.1% increase, followed by Las Vegas with 7.3%.
San Diego’s cooldown isn’t happening in a vacuum either. National home prices were up 4.3% annually in August, a slight dip from the 4.8% increase the previous month.
It’s no surprise affordability is becoming a big challenge. Over the past five years, home prices in the U.S. have shot up by over 50%, and mortgage rates haven’t made things any easier, said Lisa Sturtevant, Bright MLS’s Chief Economist.
Mortgage rates, at least, showed some relief towards the end of summer. On the last day of August, the average 30-year fixed-rate mortgage was 6.35%, a dip from May’s high of 7.22%. But as of Tuesday morning, rates were already back up to 7.08%, according to Mortgage News Daily. We’re already seeing the impact here: San Diego homes now sit on the market for an average of 28 days—double what it was earlier in the year.
In other parts of California, Los Angeles ranked 6th with a 5.9% increase, while San Francisco came in 14th with a 2.8% rise. Denver and Portland rounded out the list with modest gains of 0.7% and 0.8%.
According to Zillow’s Chief Economist Skylar Olsen, while buying might feel tougher, current homeowners are likely to keep seeing their property values rise. As we roll into fall, sellers may find buyers less willing to pay premium prices, but equity remains high—especially in areas like the northern and southwestern U.S.
Annual Price Growth by Metro (August 2024)
- New York: 8.1%
- Las Vegas: 7.3%
- Chicago: 7.2%
- Cleveland: 6.9%
- Detroit: 6.0%
- Los Angeles-Anaheim: 5.9%
- San Diego: 5.7%
- Boston: 5.5%
- Washington, D.C.: 5.4%
- Seattle: 5.2%
- Miami: 5.1%
- Charlotte: 5.0%
- Atlanta: 3.7%
- San Francisco: 2.8%
- Phoenix: 2.1%
- Minneapolis: 2.0%
- Tampa: 1.7%
- Dallas: 1.6%
- Portland: 0.8%
- Denver: 0.7%
- National Average: 4.3%


